— 2024 · R&D Intern
IQ Vizyon — Production Monitoring
Real-time telemetry from production machines via Node-RED, MQTT, and Grafana.
Problem
IQ Vizyon’s production line ran multiple machines with no central data collection. Metrics like noise, temperature, humidity, and working time were invisible in real time.
Goal: collect sensor data from machines, process it, store it, and make it visible from a single screen.
Approach
MQTT data bus. Sensors publish readings to an MQTT broker. The lightweight protocol keeps latency low across the factory floor.
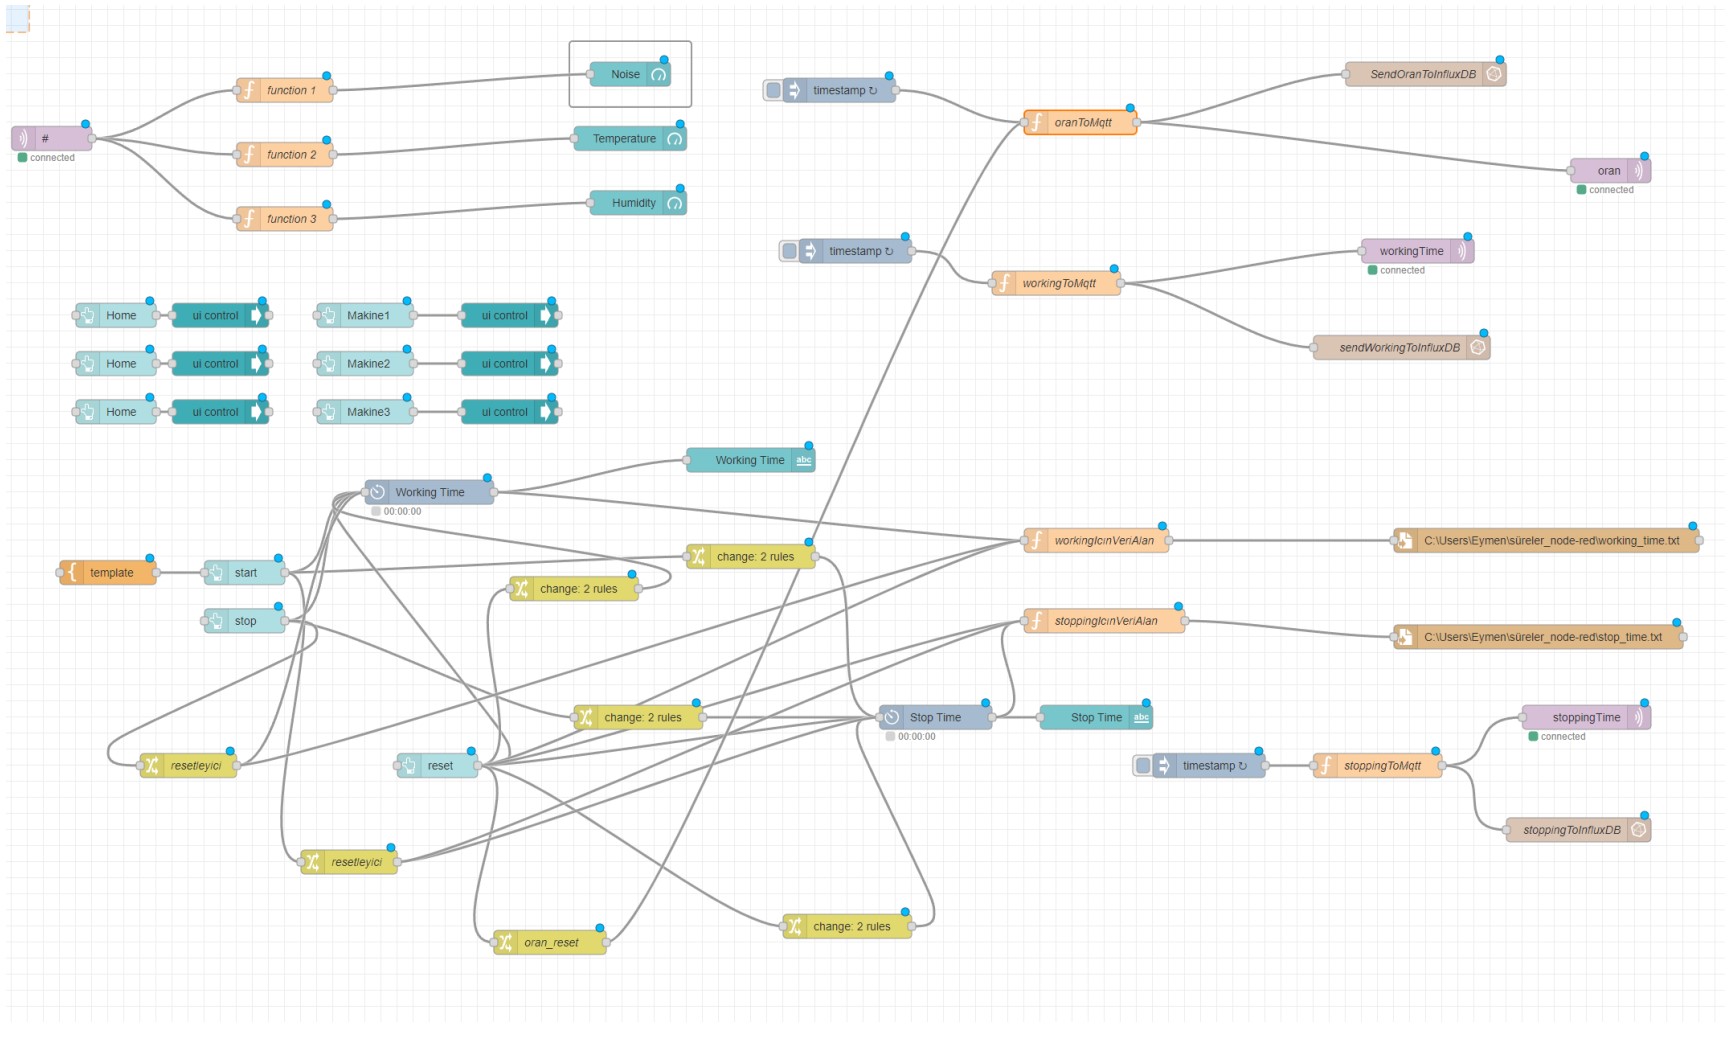
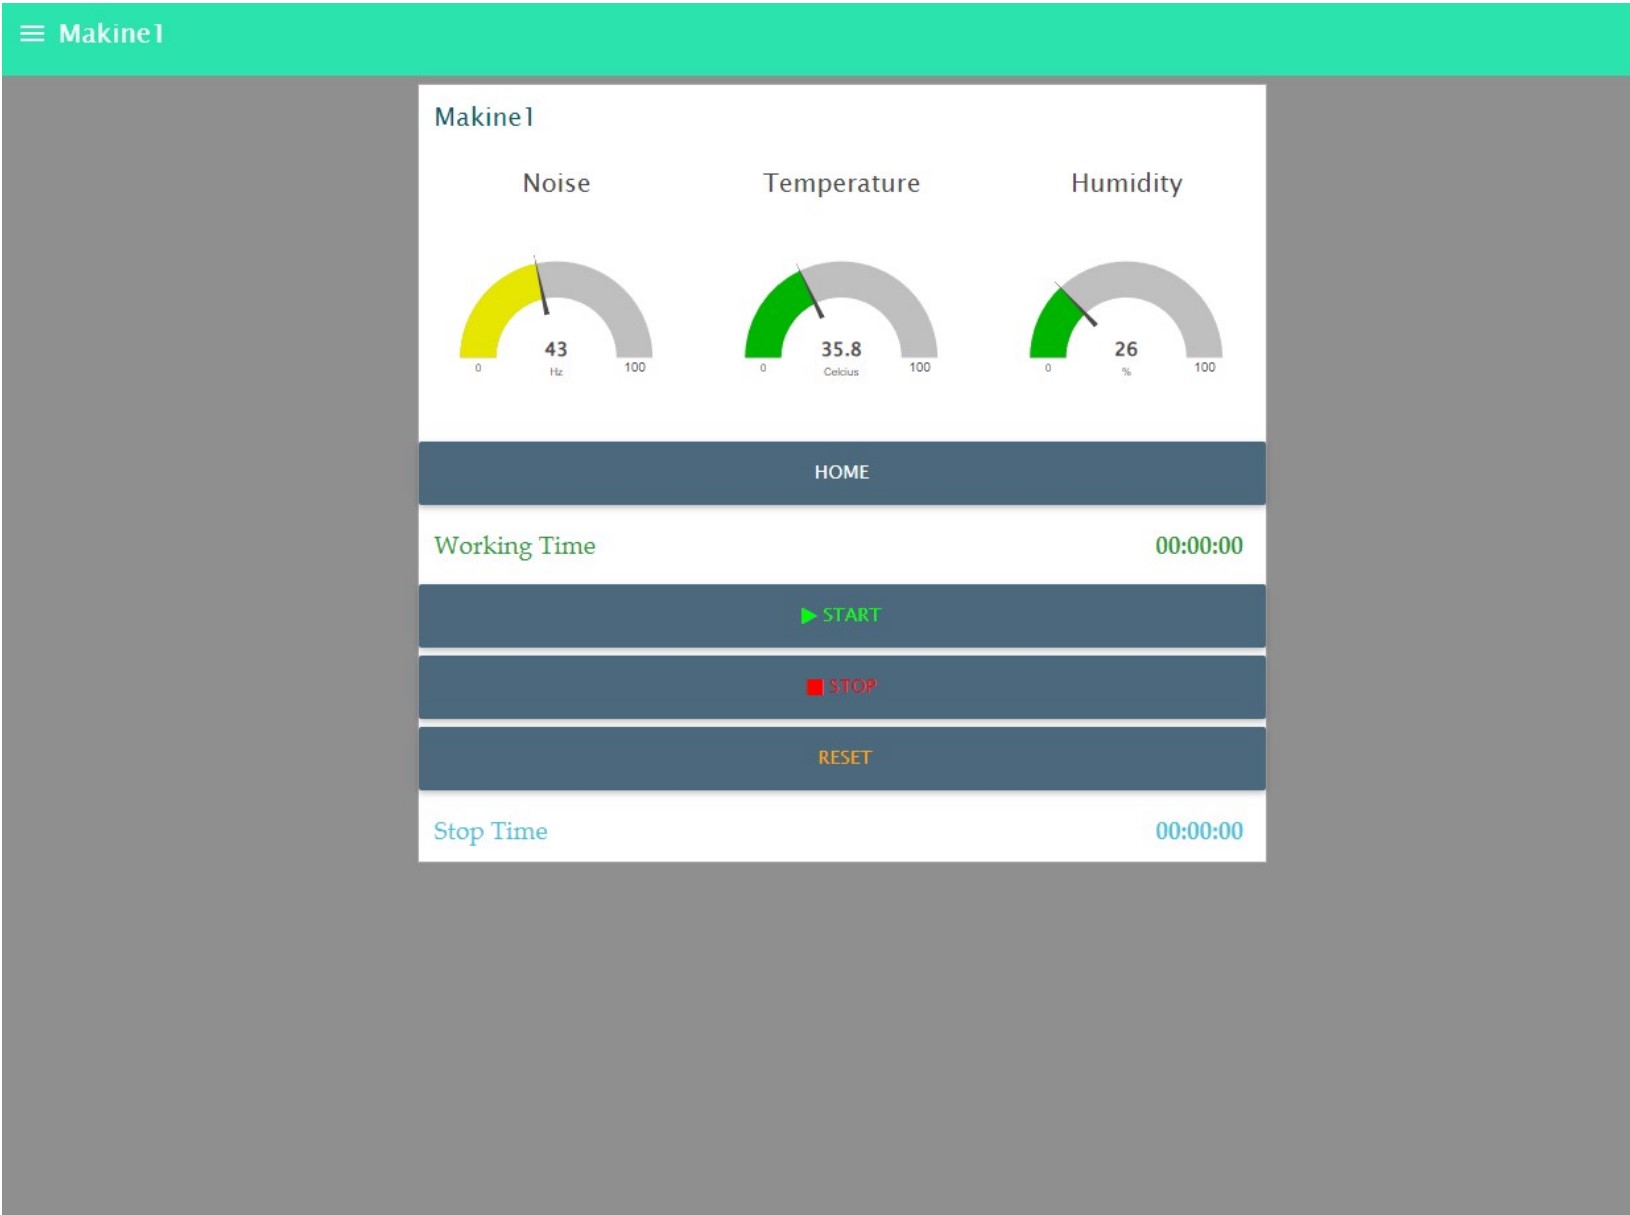
Node-RED flows. A dedicated flow was defined per machine type — incoming messages were parsed and written to InfluxDB. Gauge and time-chart widgets were wired up for the live dashboard. Automated email alerts were configured for machine downtime events, so operators are notified without watching the dashboard continuously.
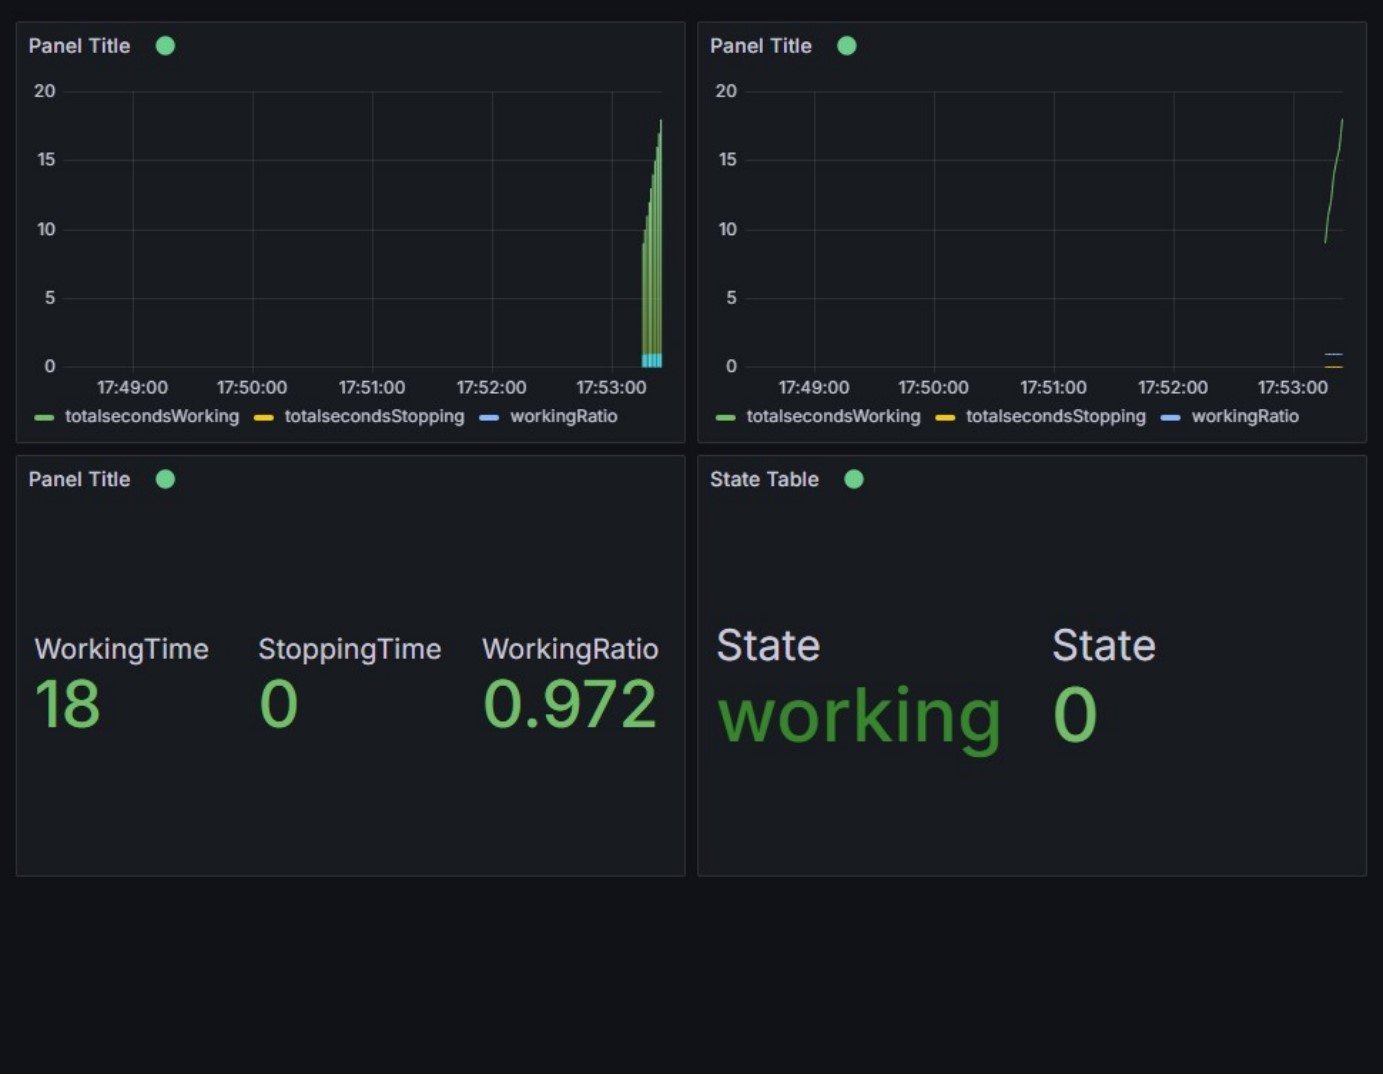
Grafana + InfluxDB. Time series records are stored in InfluxDB. Grafana surfaces WorkingTime, StoppingTime, and WorkingRatio live, with historical data queryable on demand.
Lessons
- Node-RED’s low-code approach dramatically speeds up prototyping, but flow version control becomes painful as complexity grows.
- MQTT QoS selection directly shapes the latency-vs-reliability trade-off — getting it wrong shows up as missing data points under load.
- InfluxDB’s Flux query language has a real learning curve compared to relational SQL, but windowed aggregations are genuinely powerful once you understand it.